What is success?
Is success measured in downloads, or up-loads? are bugs filed as good as bugs fixed? are volunteer marketers as valuable as volunteer developers? If we have lots of bugs filed and lots of volunteer management material is that success? is the pace of change important? Does successful QA exist to create process to slow and reject changes, or by accelerating inclusion of fixes improve quality? Is success having complete, up-to-date and detailed specifications for every feature? Is success getting everyone to slavishly obey laborious multi-step processes, before every commit? Alternatively does success come through attracting and empowering developers, who have such fun writing the code that they volunteer their life, allegiance and dreams to improve it?
I encourage people to download & use OpenOffice.org in one of it's derivatives. I'm pleased when people file bugs, help with the QA burden, promote the projet etc. However, in a Free Software project the primary production is developing and improving the software - ie. hacking. So the question is: how is OpenOffice.org doing in this area? Are we a success in attracting and retaining hackers? Is the project sufficiently fun to be involved in that lots of people actually want to be involved?
As we are finally on the brink of switching away from the creaking (22 years old) CVS (provided by Collab.net), to an improved Sun hosted Subversion (sadly not a DRCS) - Kohei and I created a set of scripts to crunch the raw RCS files as they go obsolete. They reveal an interesting picture.
Caveats
As with any measurement task, we believe these numbers are fairly reasonable; and we try to make them meaningful. On the other hand perhaps there is some horrendous thinko in the analysis, bug reports appreciated. It'd also be nice to see if the internal Sun statistics match these.
Firstly - the data is dirty; since we're analysing RCS files; so - when files are moved to the binfilter, or even renamed they have been simply re-committed - causing huge commit spikes. Similarly license changes, header guard removals and various other automated clean-ups, or check-ins of external projects cause massive signal swamping spikes. We have made some (incomplete) attempts to eliminate a few of these. In recentish times all work happens on a CVS branch, which is later merged release engineers (who appear to have done ~50% of the commits themselves), so we filter their (invaluable) contribution out by account name (cf. rt's oloh score).
Secondly - another distorting factor is that we chart only lines added: in fact when you change a line it is flagged as an add and a remove; so the number is more correctly lines added or changed. This of course fails to capture some of the best hacking that is done: removing bloat, which should be a prioirity. In the Linux kernel case this metric also gives extra credit to bad citizens that dump large drivers packed with duplicated functionality, and worse it rewards cut & paste coding. I don't often agree with Bill Gates but:
Measuring programming progress by lines of code is like measuring aircraft building progress by weight.still at least the 'lines changed' facet should be helpful.
Thirdly - release cycles cause changes in contribution patterns, clearly frantic activity during feature development lapses into more bug-fixing later in the cycle. Thus we expect to see some sort of saw-shape effect.
Fourthly, working on OO.o is infernally difficult, getting code up-stream is extremely and unnecessarily painful - this results in many contributors leaving their code in patches attached to bugs in the issue tracker, and we make no account for these; these changes (if they are committed at all) would appear to be Sun commits. Thus it is possible that there is at least somewhat wider contribution than shown. Clearly we would hope that full-time contributors would tend to commit directly to CVS themselves.
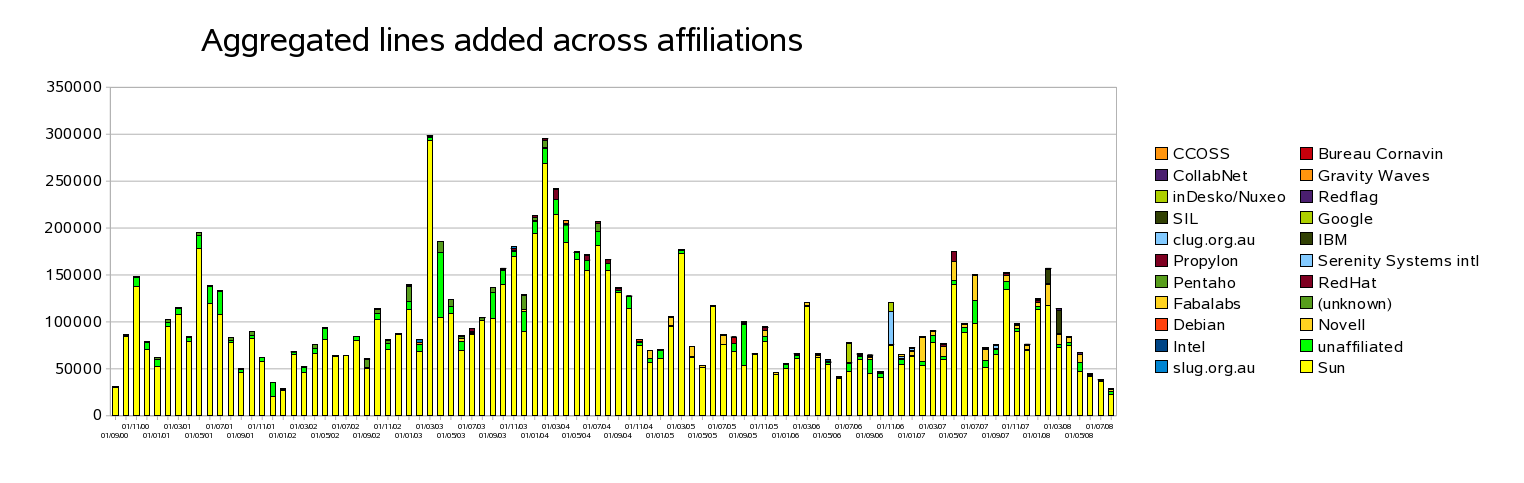
Magnitude of contributions
This graph is more meaningless than it might first appear, the raw data still shows noise like individuals committing obvious sillies copying chunks of OO.o to the binfilter eg. To some extent it is further distorted by us trying to clean this up for the past couple of years before giving up:
So the data is not that useful. Is it more useful to look at an individual to see if they are contributing something? If we threshold the data we can at least approximate an activity metric / boolean. The graph below shows two developers - the Sun developer Niklas Nebel, and the Novell hacker Kohei Yoshida. Both work primarily on calc, and you can see the large bar when Kohei committed his solver to a branch at the end of 2006.
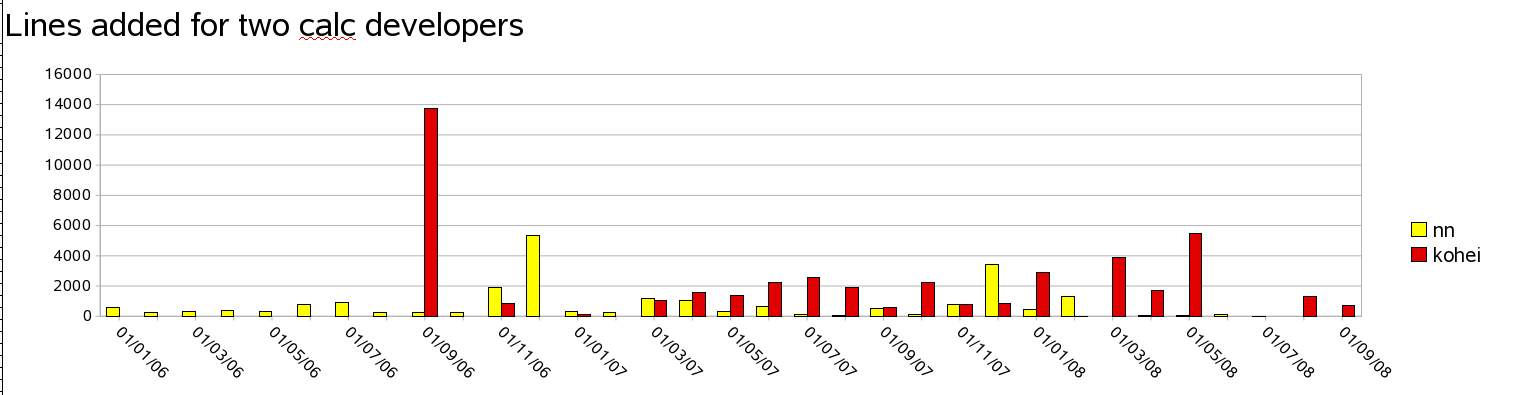
It seems clear that we can at least approximate activity with some thresholding. More interesting than this though, we can see a most curious thing. Despite Calc (apparently) being the relative weakness of OO.o, and Niklas being the maintainer of the calc core engine, and the calc "Project Lead" (with special voting privileges for the 'community' council), in fact he hasn't committed any real amount of code recently. That jumps out in the comparison with (vote-less) Kohei in the last six months. It is very sad indeed to all but loose Niklas from the project, though at least we'll see him at OOoCon. Verifying this counter-intuitive result with bonsai reveals the same picture.
Activity graphs
Extending this metric to the entire project we see perhaps a more interesting picture. By thresholding contributions at one hundred lines of code added/changed per month, we can get a picture of the number of individuals committing code to OO.o. Why one hundred? why not? it's at least a sane floor. Clearly we get a metric that is very easy to game, but luckily that's hard to do retrospectively.
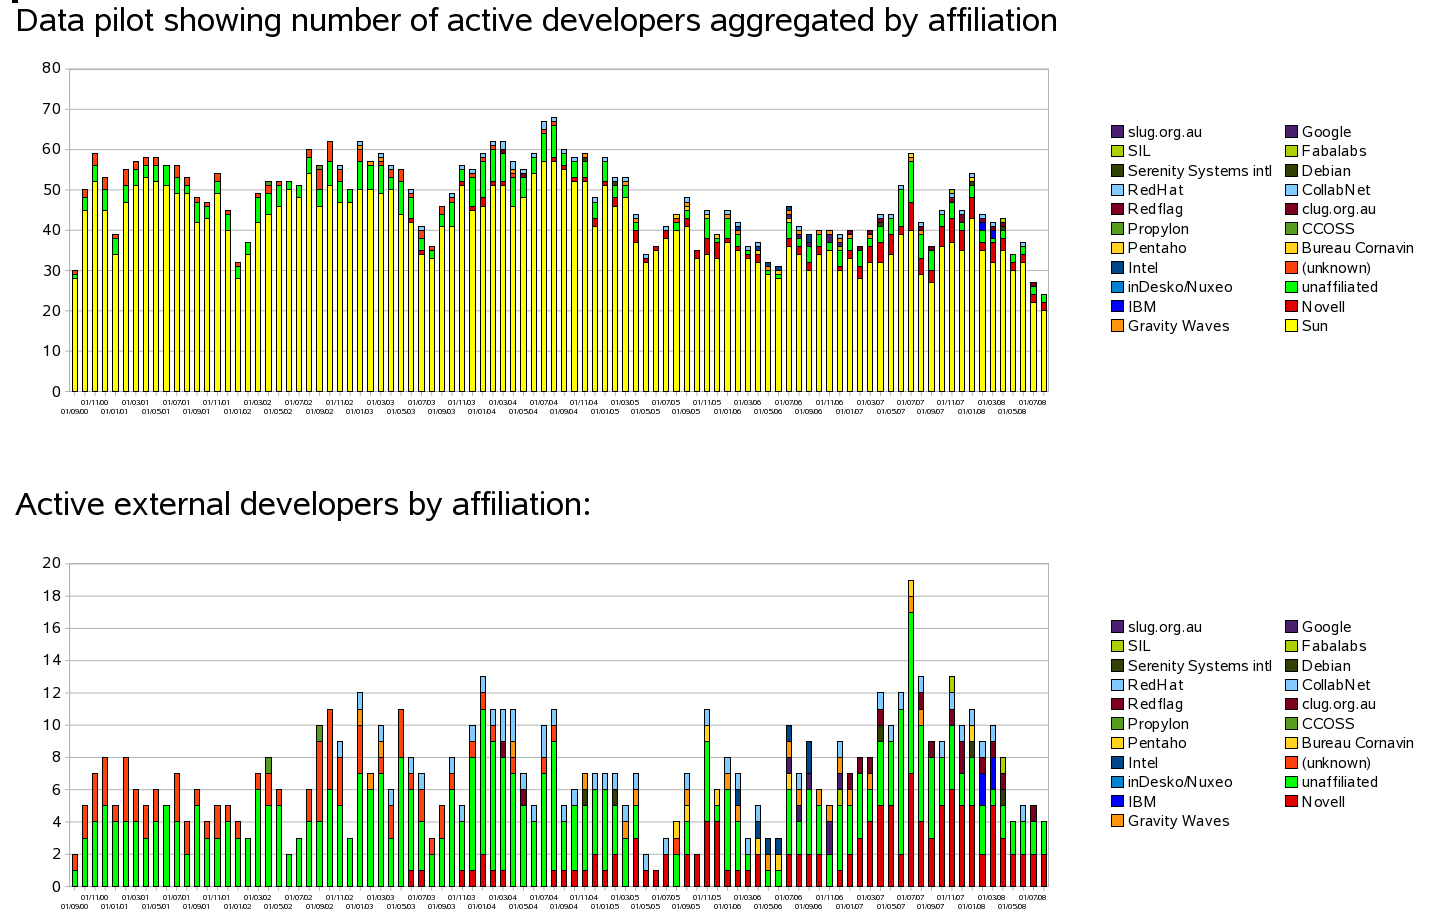
It is clear that the number of active contributors Sun brings to the project is continuing to shrink, which would be fine if this was being made up for by a matched increase in external contributors, sadly that seems not to be so. Splitting out just the external contributors we see some increase, but not enough:
Novell's up-stream contribution appears small in comparison with the fifteen engineers we have working on OO.o. This has perhaps two explanations: of course we continue to work on features that are apparently not welcome in Sun's build cf. the rejection of Kohei's solver late in 2007, and much of the rest of our work happens in ooo-build, personal git repositories, and is subsequently filed as patches in IZ.
A comparison
So, it should be clear that OO.o is a profoundly sick project, and worse one that doesn't appear to be improving with age. But what does a real project look like that is alive? By patching Jonathon Corbet's gitdm I generated some similar activity statistics for the Linux kernel, another project of equivalent code size, and arguably complexity:
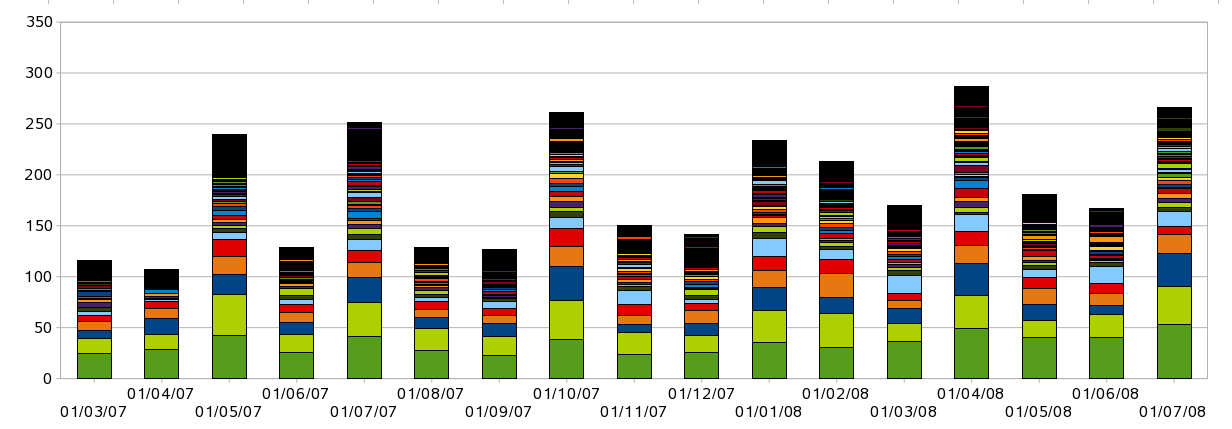
Graph showing number and affiliation of active kernel developers (contributing more than 100 lines per month).
Quick affiliation key, from bottom up: Unknown, No-Affiliation, IBM, RedHat, Novell, Intel ...
There are a number of points of comparison with the data pilot of active developers aggregated by affiliation for OO.o.
Similarities: both graphs show the release cycle. Spikes of activity at the start reducing to release. Linux' cycle is a loose 3 months, vs. OO.o's 6 months.
Differences: most obviously, magnitude and trend: OO.o peaked at around 70 active developers in late 2004 and is trending downwards, the Linux kernel is nearer 300 active developers and trending upwards. Time range - this is drastically reduced for the Linux kernel - down to the sheer volume of changes: eighteen months of Linux' changes bust calc's row limit, where OO.o hit only 15k rows thus far. Diversity: the linux graph omits an in-chart legend, this is a result of the 300+ organisations that actively contribute to Linux; interestingly, a good third of contribution to Linux comes from external (or un-affiliated) developers, but the rest comes from corporates. What is stopping corporations investing similarly in OO.o?Conclusions
Crude as they are - the statistics show a picture of slow disengagement by Sun, combined with a spectacular lack of growth in the developer community. In a healthy project we would expect to see a large number of volunteer developers involved, in addition - we would expect to see a large number of peer companies contributing to the common code pool; we do not see this in OpenOffice.org. Indeed, quite the opposite we appear to have the lowest number of active developers on OO.o since records began: 24, this contrasts negatively with Linux's recent low of 160+. Even spun in the most positive way, OO.o is at best stagnating from a development perspective.
Does this matter? Of course, hugely ! Everyone that wants Free software to succeed on the desktop, needs to care about the true success of OpenOffice.org: it is a key piece here. Leaving the project to a single vendor to resource & carry will never bring us the gorgeous office suite that we need.
What can be done? I would argue that in order to kick-start the project, there is broadly a two step remedy:
- Kill the ossified, paralysed and gerrymandered political system in OO.o. Instead put the developers (all of them), and those actively contributing into the driving seat. This in turn should help to kill the many horribly demotivating and dysfunctional process steps currently used to stop code from getting included, and should help to attract volunteers. Once they are attracted and active, listen to them without patronizing.
- Distance the project from Sun: perhaps less branding, certainly less top-down control, reduce the requirement to 'share' all your rights over to Sun before you can contribute to the project. Better still, share ownership of the code with a non-profit foundation to guarantee stability and an independent future for the code-base.
Unfortunately, the chances of either of these points being addressed in full seem fairly remote - though, perhaps there will continue to be some grudging movement in these directions.
A half-hearted open-source strategy (or execution) that is not truly 'Open' runs a real risk of capturing the perceived business negatives of Free software: that people can copy your product for free, without capturing many of the advantages: that people help you develop it, and in doing so build a fantastic support and services market you can dominate. It's certainly possible to cruise along talking about all the marketing advantages of end-user communities, but in the end-game, without a focus on developers, and making OO.o truly fair and fun to contribute to - any amount of spin will not end up selling a dying horse.
Postscript
Why is my bug not fixed? why is the UI still so unpleasant? why is performance still poor? why does it consume more memory than necessary? why is it getting slower to start? why? why? - the answer lies with developers: Will you help us make OpenOffice.org better? if so, probably the best place to get started is by playing with go-oo.org and getting in touch, please mail us.
Finally - we invite you to repeat the analysis, the raw spreadsheet data (for data-miners) is here: ooo-stats.ods linux-stats.ods and the RCS parsing scripts parse_rcs.py with dependants in that same directory.